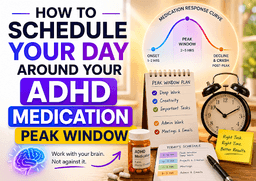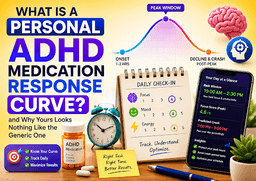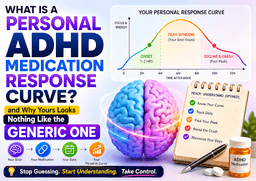
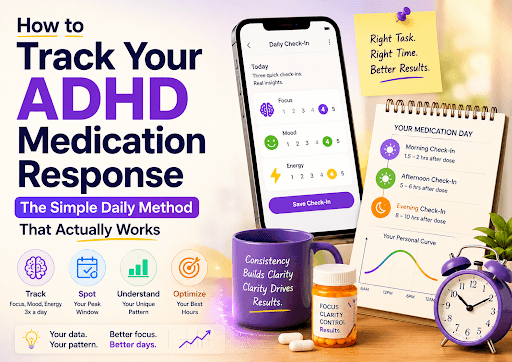
Here is something most people with ADHD don't realise: the medication timing chart your doctor references — or the one you find in any pharmacology guide — was not built from your data. It was built from population averages across thousands of different people with different metabolisms, different doses, different ages, and different body compositions.
That chart might describe the average person's Adderall response reasonably well. But you are not the average person. You are you. And your medication curve is uniquely yours.
This is where AI changes everything.
The Problem With Generic Pharmacokinetic Charts
Pharmacokinetics is the study of how drugs move through the body — how they are absorbed, distributed, metabolised, and eliminated. Standard pharmacokinetic charts show a smooth bell curve: the medication rises to a peak, holds for a window, then falls.
These charts are accurate descriptions of population-level averages. But individual variation around those averages is enormous.
What makes your curve different from the average?
- Metabolism speed: Fast metabolisers process stimulants more quickly — their peak arrives sooner and falls off faster. Slow metabolisers experience a delayed, longer-lasting arc.
- Dose amount: Higher doses shift the peak height but can also affect duration and crash severity.
- Food timing: Taking medication with a high-fat meal can delay absorption and shift the entire curve.
- Sleep quality: Poor sleep the night before consistently flattens the peak and brings forward the crash.
- Stress and cortisol: Elevated stress hormones interact with dopamine pathways, effectively compressing the focus window.
- Hormonal cycles: For many people, hormonal fluctuations across the month cause significant day-to-day variation in medication response.
A generic chart accounts for none of these individual variables. It simply cannot.
What Manual Pattern Analysis Gets Right — and Wrong
Dedicated individuals sometimes attempt to analyse their own medication patterns manually. They build spreadsheets, plot hourly ratings, look for trends over weeks of data.
This approach gets one thing exactly right: the recognition that personal data is more valuable than population averages.
But manual analysis has serious limitations:
Volume:* Detecting a reliable pattern in noisy daily data requires more data points than most people can maintain tracking long enough to collect.
Confounding variables: Identifying that your crash arrived 40 minutes earlier on Tuesday is easy. Understanding why* — and whether it correlates with Monday's late dose, poor sleep, or skipped breakfast — requires holding multiple variables in mind simultaneously across weeks of records.
Recency bias:* Human pattern recognition naturally overweights recent experiences. If your last three days were unusually good, you tend to assume that is your baseline — even if your 30-day average tells a different story.
No predictive output:* A spreadsheet tells you what happened. It cannot tell you what will happen tomorrow based on today's dose time and last night's sleep.
How AI Approaches the Same Problem Differently
AI pattern analysis does not replace your data — it amplifies it. The same check-in ratings that would fill a spreadsheet are used by an AI system to do something fundamentally different: build a predictive model.
Here is what that process looks like in practice:
Step 1 — Data collection
Your focus, mood, and energy ratings from each check-in — timestamped and linked to that day's dose log — form the raw input.
Step 2 — Baseline construction
Using your medication type, dose, and metabolism setting, the AI begins with a pharmacologically-informed starting curve. This is not a generic chart — it is a parameterised starting point calibrated to your specific medication and metaboliser type.
Step 3 — Personal calibration
As check-in data accumulates over 7–14 days, the AI progressively adjusts the curve to match your observed response. Days where your actual ratings diverged from the predicted curve inform the model's recalibration.
Step 4 — Pattern extraction
The AI identifies your personal peak start time, peak end time, crash signature, and average window duration — not from a textbook but from your own observed data.
Step 5 — Predictive output
Given today's dose time and your personal response history, the AI generates a predicted curve for today — telling you when your peak window is likely to open and when to expect it to close.
What Changes When Your Analysis Is Personal
The practical impact of personalised AI analysis on daily life is significant:
- You stop scheduling important work during your personal crash window — because you now know when that window actually is
- You start protecting your peak hours — because you get a notification when they open
- You notice drift before it affects your performance — because the AI detects gradual timing shifts you would never catch manually
- You bring real data to your next psychiatrist appointment — instead of vague descriptions of "some days are better than others"
Key Takeaways
- Generic pharmacokinetic charts describe population averages — not your individual response
- Individual variation in ADHD medication response is driven by metabolism, sleep, food, stress, and hormonal factors
- Manual spreadsheet analysis captures the right instinct but cannot deliver predictive outputs
- AI pattern analysis builds a personal response model that improves in accuracy with every check-in
- Personalised analysis transforms tracking data into actionable scheduling intelligence
Frequently Asked Questions
How much data does AI need before the analysis becomes personal?
Most AI systems require approximately 7 days of consistent check-in data before the curve begins reflecting personal patterns rather than generic starting parameters. Accuracy continues to improve through day 14 and beyond.
Is AI-generated medication analysis medically accurate?
AI medication pattern analysis is a personal tracking tool — not a clinical or medical assessment. It reflects your self-reported experience and should be used for personal scheduling awareness, not medical decision-making.
What happens to my data when AI analyses it?
In well-designed systems, your raw check-in data is sent to the AI in a structured, anonymised format. Your name, email, and directly identifiable information should never be included in AI processing requests.
Can AI detect if my medication is losing effectiveness over time?
AI pattern analysis can detect shifts in your observed response — such as declining peak ratings over multiple weeks — but it cannot diagnose tolerance or clinical effectiveness changes. Always discuss such observations with your prescribing doctor.
Does AI analysis work for non-stimulant ADHD medications?
Yes, though the pattern looks different. Non-stimulants like Strattera build gradually rather than producing a daily arc. AI can track mood and energy trends over weeks to identify the medication's cumulative effect.