Open any pharmacology reference and you will find a neat bell curve for your ADHD medication. It rises smoothly, peaks at a predictable hour, holds for the stated duration, then falls off cleanly at the other side.
It looks authoritative. It looks precise. And for your body, on any given day, it is probably wrong.
Not wildly wrong — but wrong enough to matter. Wrong enough that if you scheduled your most demanding work around that generic curve, you would regularly find yourself trying to think clearly during your actual crash window.
Understanding what a personal medication response curve actually is — and why yours differs from the textbook version — is the foundation of everything that makes ADHD medication timing useful in practice.
What a Medication Response Curve Actually Represents
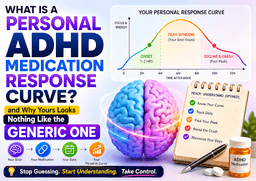
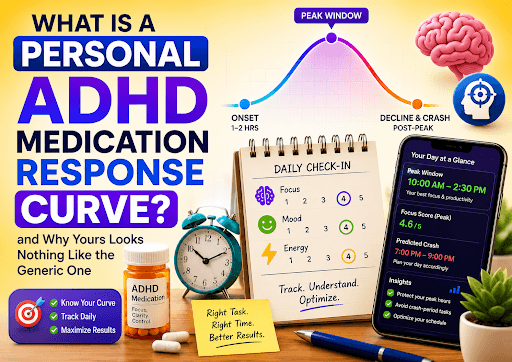
A medication response curve is a visualisation of how your focus, cognitive performance, and energy levels change over time following a dose of ADHD medication.
The x-axis is time — from the moment you take your medication through the rest of the day. The y-axis is your functional output — a composite of focus quality, mental clarity, and energy availability.
The curve has three distinct phases:
Onset phase:* The medication is being absorbed and beginning to act. Dopamine and norepinephrine availability in the prefrontal cortex gradually increases. Focus and energy begin to climb.
Peak window:* The medication is at or near its maximum effect. This is the period of highest cognitive availability — the time when demanding intellectual work is most accessible.
Decline and trough:* The medication's effects begin to wane. For many people this is not simply a return to baseline — it can involve a temporary dip below baseline, experienced as irritability, brain fog, difficulty forming sentences, and emotional dysregulation. This is commonly called the "crash."
Why the Generic Curve Gets It Wrong for Most People
The generic pharmacokinetic curve is derived from clinical trials conducted on large populations. It describes the average absorption, peak, and elimination profile across those populations.
The problem is that "average" conceals enormous individual variation.
Onset timing varies widely
For an extended-release stimulant, the average onset is typically listed as 1–2 hours. In practice, individuals report functional onset anywhere from 45 minutes to nearly 3 hours — depending on metabolism, stomach contents, and formulation response.
Peak duration is not fixed
The stated duration for Adderall XR is 8–10 hours. Real-world individual experiences range from 5 hours to 12 hours for the same medication at the same dose. What determines this? Primarily your personal metabolic rate for that compound — which is genetically influenced and cannot be predicted from the label.
The crash is not universal
Some people experience no meaningful crash — their medication wears off smoothly back to baseline. Others experience a pronounced trough that can last 1–2 hours and feel significantly worse than their pre-medication state. The generic curve shows a smooth decline. It does not model this individual variation at all.
Day-to-day variability is real and significant
Even for the same person, the same medication, at the same dose and same take time — the curve shifts day to day. Sleep quality from the previous night is probably the single largest daily variable. Poor sleep consistently compresses the peak window and intensifies the crash.
What Makes Your Personal Curve Yours
Your personal medication response curve is built from the intersection of your:
- Medication type and dose
- Metaboliser classification (fast, medium, or slow — which affects onset and duration)
- Daily check-in data (your actual observed focus, mood, and energy ratings throughout the day)
- Dose timing history (when you actually take your medication, not when you intend to)
- Observed patterns over 7–14+ days of consistent data
The result is a curve that reflects what your medication actually does for you — not what it does for the average person in a clinical trial.
What a Personal Curve Reveals That the Generic One Cannot
Once your personal curve is established through consistent tracking, it reveals several things that have immediate practical value:
Your actual peak start time.* This is often earlier than the generic guidance suggests for fast metabolisers and later for slow metabolisers. Knowing this precisely means you can stop missing your best hours.
Your real window duration.* If your peak window is consistently 4.5 hours rather than the stated 8, you can plan accordingly — stopping important work before the window closes rather than being caught mid-task.
Your personal crash signature.* The specific combination of focus drop, mood shift, and energy decline that signals your window is closing. Recognising this pattern in advance is the difference between managing your crash and being surprised by it.
Your drift pattern.* Whether your take time has gradually shifted over weeks — which moves your entire peak window and can make you feel like your medication has stopped working when it has simply been displaced in time.
Key Takeaways
- A medication response curve maps how your focus, energy, and mood change throughout the day following a dose
- Generic pharmacokinetic curves describe population averages — individual variation around those averages is substantial
- Onset timing, peak duration, and crash severity vary widely between individuals
- Your personal curve is built from your own check-in data combined with your medication and metabolism profile
- A personal curve reveals your actual peak start time, real window duration, and crash signature
Frequently Asked Questions
How is a personal response curve different from what my doctor tells me?
Your doctor references population-average pharmacokinetic data. This is accurate at a population level but cannot predict your individual response. A personal curve is built from your own observed data — it reflects your biology, not the average.
Can my personal curve change over time?
Yes. Significant life changes — weight changes, new medications, hormonal shifts, chronic stress — can all shift your response curve. This is why ongoing tracking is more valuable than a one-time assessment.
What does the "trough" on the curve feel like?
Most people describe it as a combination of brain fog, irritability, difficulty finding words, reduced emotional regulation, and a general feeling of flatness or low motivation. It typically lasts 30–90 minutes before returning to baseline.
Does coffee affect the personal response curve?
Caffeine has a mild stimulant effect that can interact with ADHD medications. Some people find that coffee taken near their dose onset slightly extends their peak window. Others find it amplifies anxiety during the peak or deepens the crash. Individual responses vary significantly.
How long does it take to establish a reliable personal curve?
With consistent daily check-ins, a reliable personal curve typically emerges after 7–10 days. The curve continues to refine and improve in accuracy with each additional week of data.